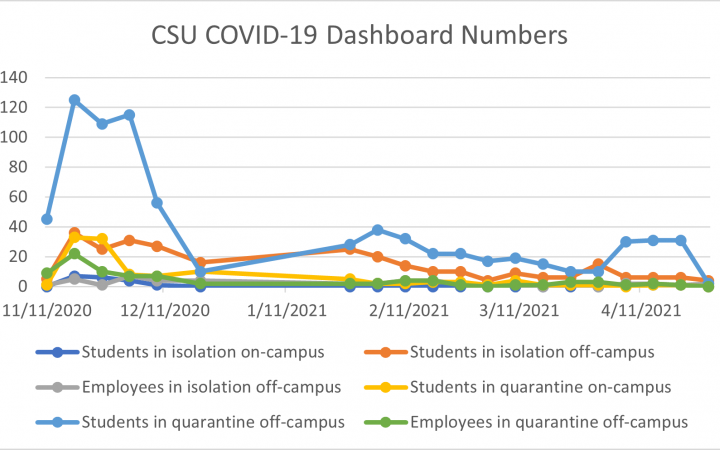
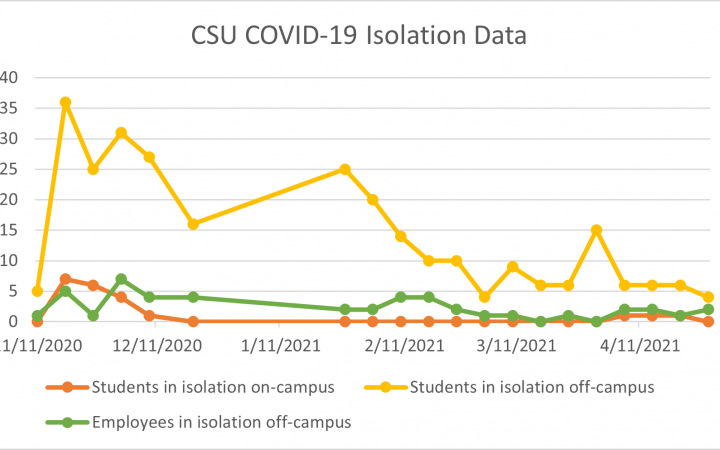
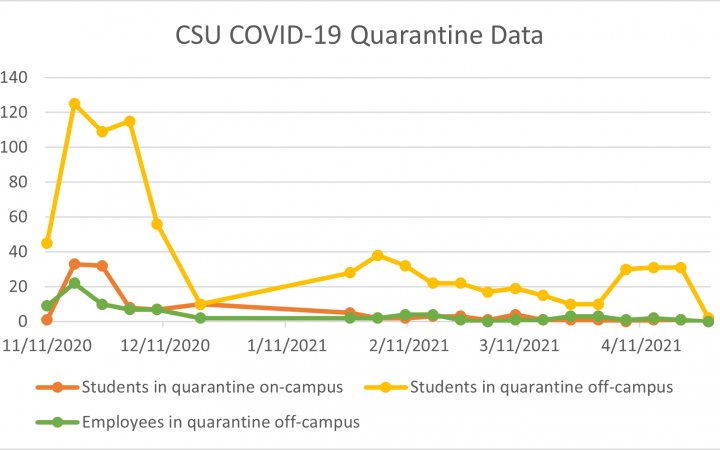
The Cleveland Stater has been tracking all COVID-19 data that CSU has released on its COVID-19 dashboard since November 2020.
Recent News
Former WCSB general manager says lawsuit signals a wider fight for college radio
By NICOLE WLOSZEK - posted January 16, 2026Alison Bomgardner spoke after she, WCSB and Friends of XCSB were named as the plaintiffs in a lawsuit filed Monday suing Cleveland State University for handing its student and community-run radio station to Ideastream Public Media.
Cleveland State men's tennis earns 4-3 victory at Ball State
By KATERYNA KOPYLCHAK – posted February 13, 2025The Cleveland State men's tennis team was back in action Saturday, battling to a thrilling 4-3 victory at Ball State in Muncie, Indiana.
Commentary: Has social media broken Cupid’s arrow?
By ALEXIS STRADFORD – posted February 13, 2026College has always been about getting your degree. Possibly getting the Disney fairytale ending and finding your forever partner was also on the curriculum for many. But what does Gen Z want from the day?
CSU track & field shines at Jud Logan Invitational
By MORGAN ALTEN - posted February 10, 2026Cleveland State University track and field put together a strong showing at the fifth Jud Logan Light Giver Open, hosted by Ashland University in Ashland, Ohio, Feb. 6.
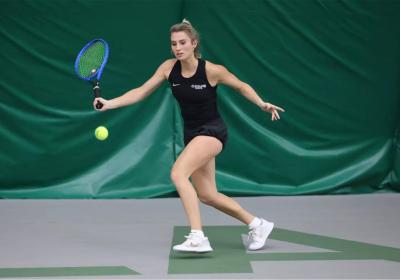
CSU women’s tennis falls 4-3 to Temple
By NICOLE WLOSZEK – posted February 7, 2026The Cleveland State women’s tennis team on Sunday finished its Morgantown, West Virginia road swing with a narrow 4-3 loss against Philadelphia's Temple University.
Residence Life hosts trivia night at Viking Marketplace
“It gets a lot of different students together, encourages them to talk to people they wouldn't otherwise talk to and just have a good time,” said Kaleb Roberts, a sophomore resident assistant.
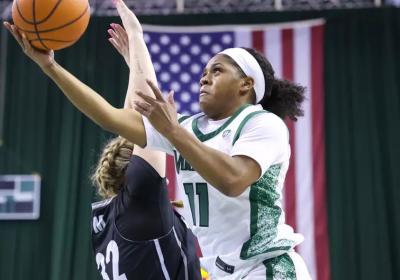
Cleveland State women’s basketball defeats Milwaukee 66-46
By The Cleveland Stater - posted January 29, 2026The win took Cleveland State to 6-6 in Horizon League play, and 16-7 overall.
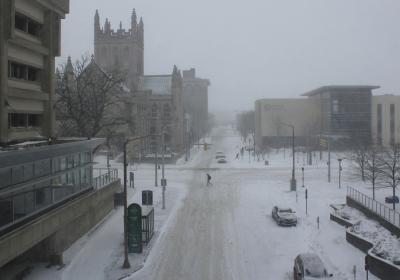
Snow puts a dampener on first week back for CSU
By KIRSTEN KIMBLER – posted January 16, 2026 Cleveland State University canceled all classes and closed business offices Thursday due to extreme weather conditions.
Neal Hodges on the SOC's broadcast minor
By THE CLEVELAND STATER - posted December 23, 2025"When I walked into communication classes 324 and 424 for the first time in September, I didn't know what to expect," said Neal Hodges, a prominent Cleveland media personality on his experience in CSU's broadcast minor.
Viking View Beyond CSU fall 2025
By COM 324, COM 424 Students - posted December 18, 2025"Viking View Beyond CSU" is the end-of-semester project of the combined Com 324 and Com 424 classes in the School of Communication at Cleveland State University. Project teachers and mentors were John Ban and Dave Tarbert.
"Best Of" The Cleveland Stater fall 2025 #3
By JANE MATOUSEK - posted December 16, 2025This edition of the “Best of” the Stater features an interview with CSU President Laura Bloomberg, Ph.D., Thanksgiving festivities at CSU, underground student fashion in Cleveland, an Umoja event, and the hapless Cleveland Browns.
Queer Student Alliance builds community through cabaret
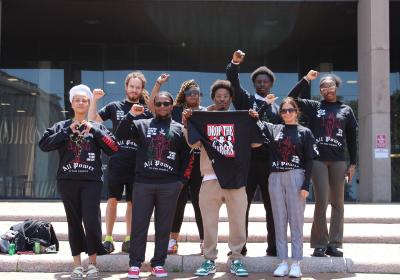
The Queer Student Alliance (QSA) at Cleveland State University held its cabaret on Wednesday, Dec. 3, in Berkman Hall Auditorium, featuring performances that highlight the importance of protecting queer art, culture and identity.
Bloomberg addresses WCSB shutdown, funding woes, loss of international students and a tough semester as president
By JANE MATOUSEK - posted December 16, 2025In a wide-ranging discussion, Cleveland State President Laura Bloomberg, Ph.D., explained how the administration sees the shuttering of WCSB, how CSU will respond if ICE comes to campus, SB1, the budget, and what matters to her in the job.
New Era Scholars promote campus and community connection
By RUBY DARWISH – posted December 9, 2025The Cleveland State University student organization extends its reach through collaboration with New Era Cleveland, emphasizing service, support and student-led leadership.
Student creations shine at the fall 2025 Digital CSU Student Showcase
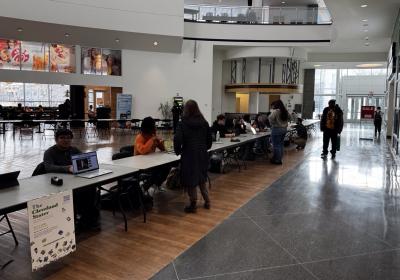
The Michael Schwartz Library sponsored the showcase in the Student Center atrium on Tuesday. Held every semester, the event gives Cleveland State students the opportunity to present their digital projects to their peers as well as faculty and staff.
Men’s basketball falls to Missouri on the road
By GRACE SALTER | Cleveland State AthleticsCleveland State men's basketball (3-6, 0-0 Horizon League) fell to Missouri (8-0, 0-0 Southeastern Conference), 86-59, on Friday afternoon at the Mizzou Arena in Columbia, Missouri.
Dean Gordon expands mentoring, launches new programs as Levin College develops strategic plan
By ALEX MARTINEZ – posted December 3, 2025The Levin College of Public Affairs and Education is working towards the launch of a new leadership program for undergraduate students and continuation of the multi-media publication that tells the stories of Levin.
Community celebrates Thanksgiving with annual Vikesgiving event
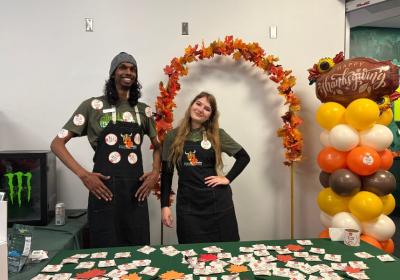
By MORGAN ALTEN - posted November 26, 2025The smell of carved turkey and peach flambé filled Cleveland State University’s Viking Marketplace Thursday evening as hundreds of students, families and community members gathered for Vikesgiving, the university’s annual Thanksgiving-style celebration offering
Murdamental shines a spotlight on Cleveland’s fashion undercurrent
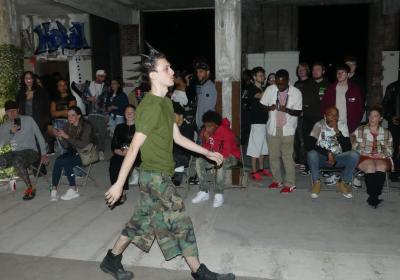
Moonlight illuminated the deteriorating pavement of East 71st Street on Tuesday, Oct. 18, as heels clicked and platform boots stomped along the road.
As the old factory building at the end of the street came into view, the bass vibrating from speakers upstairs pulsed through the earth. The once abandoned building now overflowed with more than 300 people, each arriving as the most expressive version of themselves.
CSU Rec Center launches free fall group fitness classes
By KATERYNA KOPYLCHAK – posted November 17, 2025The Cleveland State University Recreation Center has been offering fall group fitness, offering more than 20 free classes e
Africana Studies holds “Where Them Fans At/Boots on the Ground” fashion show
The Cleveland State Africana Studies Department invited the public to the Student Center Atrium on Nov. 6 for a fashion show celebrating black excellence and unity.
CSU women’s basketball secures first road win victory at Cal State Fullerton
By GRACE SALTER - posted November 14, 2025The Cleveland State women’s basketball team completed a West Coast comeback Sunday, earning a 68-61 victory at Cal State Fullerton. With the win, the Vikings improved to 2-0 on the season.
Game Stats
Cleveland State fencing earns 3 victories at OSU Elite Invitational
By KIRSTEN KIMBLER – posted November 11, 2025.The CSU fencing teams competed in The Ohio State University Elite Invitational on Nov. 8 and Nov. 9, with the women’s team earning all three combined event victories for CSU.
XCSB hosts Halloween Ball amid uncertainty following Ideastream takeover
By KIRSTEN KIMBLER – posted November 10, 2025“My day-of expectations were blown out of the water,” said Mario Benjamin, a senior popular music major at Cleveland State. “There were over 500 people in the venue. I was astonished at everyone who showed up and spent time at the ball.”
Cleveland celebrates Day of the Dead
Cleveland held its 22nd annual festival, Nov. 1, honoring those who have passed, featuring vibrant altars, a parade, and community celebrations at Gordon Square Arts District.
The Cleveland Browns continue to be the laughing stock of American sports
By ANTHONY REED – posted November 3, 2025The Cleveland Browns enter their bye week 2-6 as their offensive woes from last season continue to plague them.
The New Era Scholars host Women’s Week: “Women United” event
By KIRSTEN KIMBLER – posted October 31, 2025“We wanted women to feel community with each other,” said Angellise Gray, vice president of the New Era Scholars. “With the women's center being shut down, women have lost their safe space to talk with one another.”
CSU launches AI Teaching and Learning Lab for students
By AVA FUDURIC – posted October 28, 2025Set to open in spring 2026, the new lab in Berkman Hall will help students start to get a sense of what artificial intelligence is, experiment with it and engage ethically.
CSU students take 1st prize at media and arts festival in Vietnam
By KIRSTEN KIMBLER – posted October 20, 2025The Van Lang University auditorium buzzed with anticipation mid-summer as the animation awar
Why WCSB matters to me
By NICOLE WLOSZEK - posted October 16, 2025During my second semester at Cleveland State University, in February of 2025, I took the leap into college radio. It changed my life – then the station was taken over.

